CAC Calculate Average Item Costs
Description:
Using purchase order receipts, calculate average item costs over a specified transaction date range and compare against the Comparison Cost Type. In addition, with the Use Default Material Overheads parameter you can choose which material overheads to use on this report. Select Yes to use the Default Material Overhead setups. Set to No to use the material overheads from the specified Comparison Cost Type. And if planning to use roll up these item costs, to avoid doubling up rolled up material costs on assemblies, choose Yes for the parameter Exclude Rolled Up Items, to avoid having manually defined material costs and rolled up material costs.
Parameters:
Transaction Date From: enter the starting transaction date for PO Receipt History (mandatory). Transaction Date To: enter the ending transaction date for PO Receipt History (mandatory). Comparison Cost Type: enter the cost type to compare against the calculated average item costs (mandatory). If the costs are not found in the Comparison Cost Type get them from the Costing Method Cost Type. Use Default Material Overheads: set to Yes to report the material overheads based on the Default Material Overhead setups. Set to No to use the material overheads from the specified Comparison Cost type (mandatory). Only Active Rates: set to Yes to only get active, enabled default material overhead rates (mandatory). Exclude Rolled Up Items: to avoid doubling up rolled up material costs, choose Yes for this parameter, to avoid having manually defined material costs and rolled up material costs (mandatory). Currency Conversion Date: the exchange rate conversion date that was used to set the standard costs (mandatory). Currency Conversion Type: the exchange rate conversion type that was used to set the standard costs (mandatory). Show Last AP Invoice: Enter Yes to show the last AP invoice date, number and price (mandatory). Category Set 1: any item category you wish, typically the Cost or Product Line category set (optional). Category Set 2: any item category you wish, typically the Inventory category set (optional). Supplier Type to Exclude: enter the specific supplier(s) you wish to exclude from the average cost calculations (optional). Item Status to Exclude: enter the item number status you want to exclude. Defaulted to ‘Inactive’ (optional). Item Number: enter the specific item number(s) you wish to report (optional). Organization Code: enter the specific inventory organization(s) you wish to report (optional). Operating Unit: enter the specific operating unit(s) you wish to report (optional). Ledger: enter the specific ledger(s) you wish to report (optional).
/* – | Copyright 2006 - 2023 Douglas Volz Consulting, Inc. – | All rights reserved. – | Permission to use this code is granted provided the original author is – | acknowledged. No warranties, express or otherwise is included in this permission. – | – | Version Modified on Modified by Description – | ======= =========== ============== ========================================= – | 1.0 05 Jan 2019 Douglas Volz Initial Coding based on item_cost_history.sql – | 1.15 10 Jan 2023 Douglas Volz Fix for Average Cost calculations, UOM issue. – | 1.16 21 Aug 2023 Douglas Volz Remove tabs and restrict to only orgs you have access to, – | Add last payables invoice and purchase order price information. – | 1.17 25 Sep 2023 Douglas Volz Fix for the Last PO and Last A/P information – | 1.18 13 Oct 2023 Andy Haack Fix for G/L Daily Rates, outer joins – | 1.19 24 Nov 2023 Douglas Volz Fixed item number parameter for last PO information – | and fix Last A/P Invoice info for G/L Daily Rates – | 1.20 08 Dec 2023 Douglas Volz Added G/L and Operating Unit security restrictions. – +=============================================================================+*/
Parameters
Transaction Date From, Transaction Date To, Use Default Material Overheads, Only Active Rates, Exclude Rolled Up Items, Comparison Cost Type, Currency Conversion Date, Currency Conversion Type, Show Last AP Invoice, Category Set 1, Category Set 2, Category Set 3, Supplier Type to Exclude, Item Status to Exclude, Item Number, Organization Code, Operating Unit, Ledger
Used tables
mtl_units_of_measure_vl, mtl_item_status_vl, fnd_common_lookups, mfg_lookups, hr_organization_information, hr_all_organization_units_vl, gl_ledgers, mtl_material_transactions, rcv_transactions, mtl_system_items_vl, mtl_parameters, po_vendors, fnd_lookup_values_vl, org_access_view, cst_cost_types, cst_item_costs
Categories
Dependencies
If you would like to try one of these Oracle EBS SQLs without having Blitz Report installed, note that some of the reports require functions from utility package xxen_util.
Example Report
CAC Calculate Average Item Costs 11-Dec-2022 114227.xlsx
Report SQL
www.enginatics.com/reports/cac-calculate-average-item-costs/
Blitz Report™ import options
CAC_Calculate_Average_Item_Costs.xml
Case Study & Technical Analysis: CAC Calculate Average Item Costs
Executive Summary
The CAC Calculate Average Item Costs report is a sophisticated analytical tool for Cost Accountants and Procurement Managers. It calculates the “true” average cost of items based on actual Purchase Order (PO) receipts over a specified period and compares these calculated values against a standard cost type (e.g., Frozen or Pending). This analysis is crucial for validating standard costs during periodic updates, ensuring that the system’s cost definitions align with current market prices paid to suppliers.
Business Challenge
Setting standard costs is often a complex exercise involving estimation and historical analysis. Organizations face challenges such as:
- Cost Variance: Significant Purchase Price Variances (PPV) occurring because standard costs are outdated compared to actual procurement costs.
- Inflationary Pressure: Difficulty in quantifying the impact of rising supplier prices on inventory valuation.
- Overhead Allocation: Complexity in determining the correct material overheads to apply to new standard costs.
- Data Volume: The inability to manually calculate weighted average costs across thousands of items and receipts.
The Solution
The CAC Calculate Average Item Costs report automates the derivation of average costs. It enables users to:
- Validate Standards: Compare the calculated average purchase price against the current standard cost to identify items requiring revaluation.
- Simulate Overheads: Choose between using existing standard overheads or applying default overhead setups to simulate the total cost impact.
- Exclude Outliers: Filter out specific supplier types or inactive items to ensure the calculated average reflects “normal” business operations.
- Analyze Trends: View the last AP invoice and PO price alongside the average to spot recent pricing trends.
Technical Architecture (High Level)
The report performs a complex aggregation of purchasing and inventory data.
- Data Source: It queries
RCV_TRANSACTIONSandMTL_MATERIAL_TRANSACTIONSto identify receipts and their actual transaction values. - Calculation Engine: It calculates a weighted average cost: $\frac{\sum (Quantity \times Unit Price)}{\sum Quantity}$.
- Cost Comparison: It joins with
CST_ITEM_COSTSto retrieve the comparison cost (e.g., Frozen) and calculates the variance (absolute and percentage). - Overhead Logic: The query includes conditional logic (
DECODE) to apply material overhead rates either from the existing cost type or from the default category-based setups (CST_DEFAULT_COST_ELEMENT_RATES), depending on the user’s parameter selection.
Parameters & Filtering
The report offers extensive parameters for precise analysis:
- Transaction Date Range: Defines the historical period for the average cost calculation (e.g., last 6 months).
- Comparison Cost Type: The benchmark cost type (e.g., “Frozen” or “Pending”).
- Use Default Material Overheads: A toggle (‘Y’/’N’) to determine if overheads should be recalculated based on current default rules.
- Exclude Rolled Up Items: Prevents double-counting of costs for sub-assemblies if the intention is to roll up costs later.
- Show Last AP Invoice: Optionally retrieves the most recent invoice details for a “sanity check” against the average.
Performance & Optimization
The report handles large data volumes through:
- Pre-Aggregation: It aggregates receipt data by item and organization before joining to the master data, reducing the row count for subsequent joins.
- Indexed Lookups: Utilizes standard indexes on transaction dates and item IDs.
- Efficient Currency Conversion: Applies currency conversion rates at the transaction level (if needed) or uses the standard rate defined in the parameters.
FAQ
Q: How is the “Average Material Cost” calculated? A: It is the total value of PO receipts divided by the total quantity received during the specified date range.
Q: What happens if there are no receipts for an item? A: The item will not appear in the report unless it exists in the comparison cost type, depending on the join type. Typically, this report focuses on items with activity.
Q: Why can I exclude specific supplier types? A: You might want to exclude inter-company transfers or one-time spot buys from the average cost calculation to get a more representative market price.
Q: Does this update the system costs? A: No, this is a reporting tool only. It provides the data needed to make decisions about updating costs, but it does not perform the update itself.
Oracle E-Business Suite Reporting Library
We provide an open source Oracle EBS SQLs as a part of operational and project implementation support toolkits for rapid Excel reports generation.
Blitz Report™ is based on Oracle EBS forms technology, and hence requires minimal training. There are no data or performance limitations since the output files are created directly from the database without going through intermediate file formats such as XML.
Blitz Report can be used as BI Publisher and Oracle Discoverer replacement tool. Standard Oracle BI Publisher and Discoverer reports can also be imported into Blitz Report for immediate output to Excel. Typically, reports can be created and version tracked within hours instead of days. The concurrent request output automatically opens upon completion without the need for re-formatting.
The Filters, Columns, Rows and Values fields are used to create and deliver the data in pivot table format with full drill down to details.
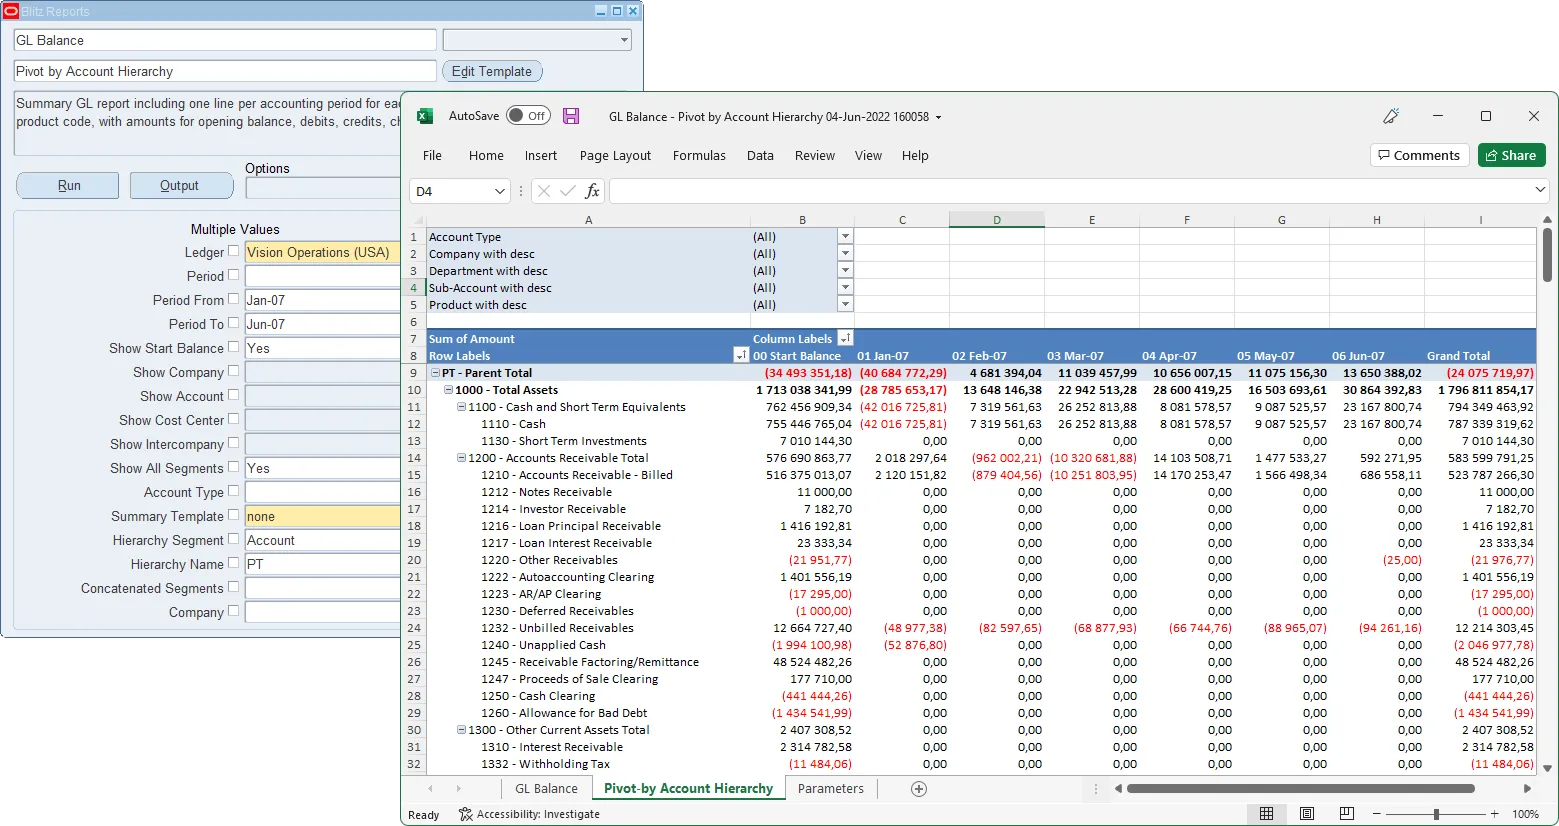
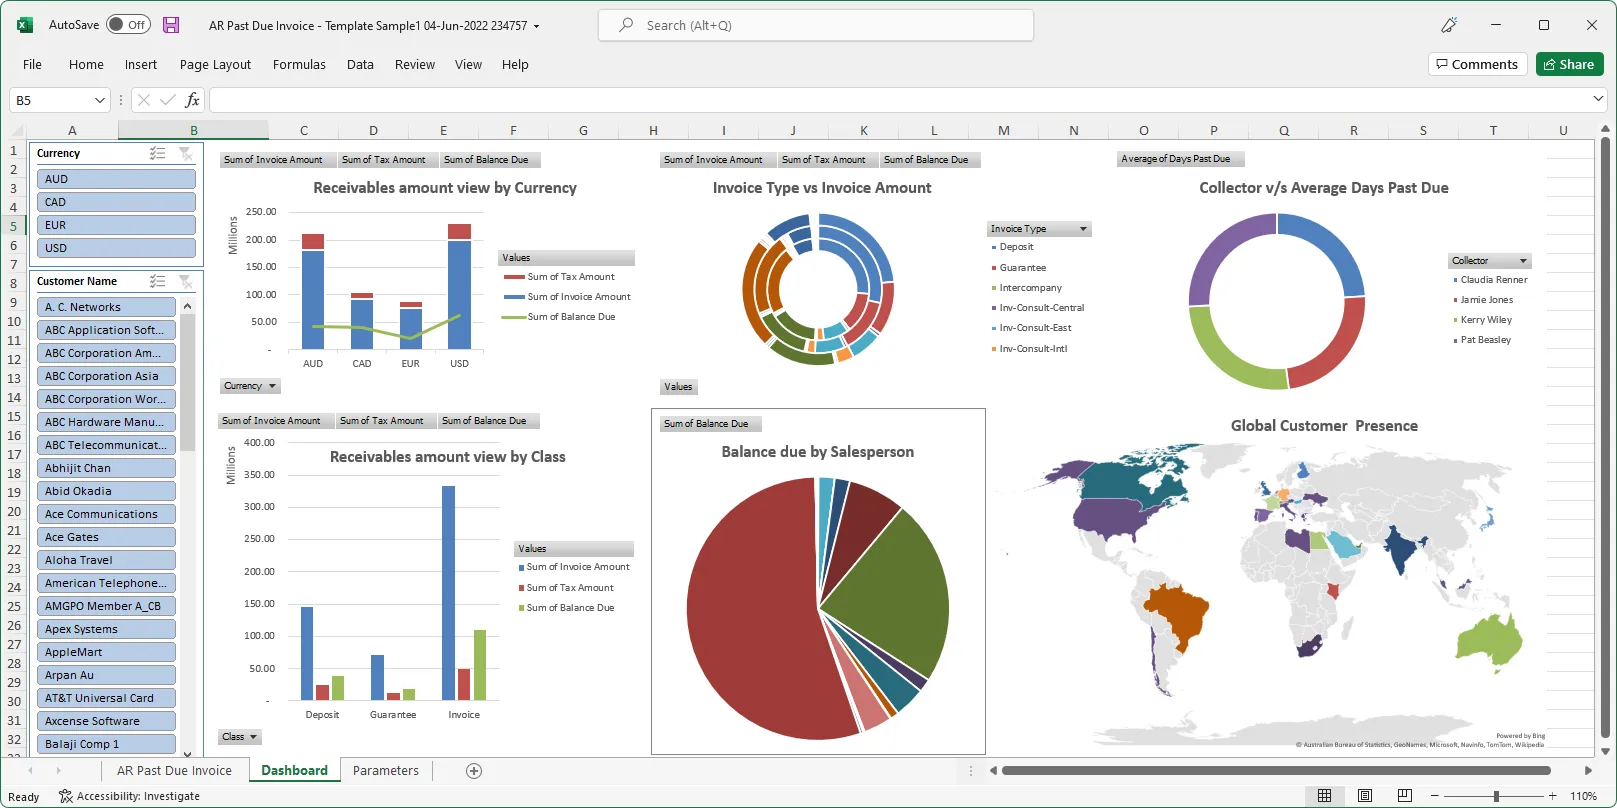
The Excel template upload functionality in Blitz Report allows users to create their own layouts by uploading an Excel template with additional sheets and charts, automatically refreshed when the report runs again. This allows to create custom dashboards and more advanced visualizations of report data.
You can download and use Blitz Report free of charge for your first 30 reports.
The installation and implementation process usually takes less than 1 hour; you can refer to our installation and user guides for specific details.
If you would like to optimize your Oracle EBS implementation and or operational reporting you can visit www.enginatics.com to review great ideas and example usage in blog. Or why not try for yourself in our demo environment.
Useful Links
Blitz Report™ – World’s fastest data upload and reporting for Oracle EBS
Oracle Discoverer replacement – importing worksheets into Blitz Report™
Blitz Report™ Questions & Answers
Supply Chain Hub by Blitz Report™
© 2025 Enginatics