DBA AWR System Metrics Summary
Description:
Historic system statistics from the automated workload repository showing CPU load, wait time percentage, logical (buffer/RAM) and physical read and write IO figures, summarized in snapshot time intervals. All IO figures are measured in MB/s.
-CPU%: Total CPU usage percentage. If this is low, the hardware is underused and performance could potentially get improved by using it better e.g. by resolving IO bottlenecks (bigger RAM, faster storage) or parallelization of SQLs and user processes. -WAIT%: Percentage of time that the DB process spends waiting rather than processing. If the wait% is high and most of the wait time is spend e.g. waiting for IO, then the storage is too slow compared to CPU speed. -BUFF_READ: Logical IO read from the buffer cache (RAM) in MB/s -PHYS_READ: Physical IO read from the storage in MB/s -PHYS_WRITE: Physical IO written to the storage in MB/s
Note: The UOM calculation from LIOs to MB uses the database default block size and doesn’t support different block sizes for different tablespaces.
Parameters
Date From, Date To, Show Daily Averages, Diagnostic Pack enabled, Container Data
Used tables
gv$system_parameter, v$parameter, &sysmetric_view, dba_hist_snapshot, &sysmetric_symmary_view
Categories
Related reports
DBA SGA+PGA Memory Configuration
Dependencies
If you would like to try one of these Oracle EBS SQLs without having Blitz Report installed, note that some of the reports require functions from utility package xxen_util.
Example Report
DBA AWR System Metrics Summary 13-Jul-2018 173115.xlsx
Report SQL
www.enginatics.com/reports/dba-awr-system-metrics-summary/
Blitz Report™ import options
DBA_AWR_System_Metrics_Summary.xml
Executive Summary
The DBA AWR System Metrics Summary report provides a high-level dashboard of the database’s vital signs over time. It summarizes key system-wide metrics like CPU Load, Wait Percentage, and I/O Throughput (MB/s). This report is ideal for spotting trends, identifying peak load windows, and correlating system behavior with user complaints.
Business Challenge
- Health Check: “Is the database healthy right now? How does it compare to last week?”
- Bottleneck Identification: “Are we CPU bound (high CPU%) or I/O bound (high Wait% and Phys Read)?”
- Throughput Analysis: “What is our peak I/O throughput? Do we need a faster SAN?”
Solution
This report aggregates system metrics from AWR snapshots.
Key Features:
- CPU %: Total CPU utilization.
- Wait %: Percentage of time sessions spent waiting.
- I/O Metrics: Buffer Read (Logical), Physical Read, and Physical Write in MB/s.
- Snapshot Granularity: Shows how these metrics evolve hour by hour.
Architecture
The report queries DBA_HIST_SYSMETRIC_SUMMARY (or similar views depending on version).
Key Tables:
DBA_HIST_SYSMETRIC_SUMMARY: Summarized system metrics.DBA_HIST_SNAPSHOT: Snapshot timing.
Impact
- Executive Reporting: Provides simple, understandable charts for management (e.g., “CPU usage is up 20% year-over-year”).
- Proactive Sizing: Helps predict when the system will hit hardware limits.
- Incident Correlation: Helps correlate “slow system” tickets with actual server load metrics.
Oracle E-Business Suite Reporting Library
We provide an open source Oracle EBS SQLs as a part of operational and project implementation support toolkits for rapid Excel reports generation.
Blitz Report™ is based on Oracle EBS forms technology, and hence requires minimal training. There are no data or performance limitations since the output files are created directly from the database without going through intermediate file formats such as XML.
Blitz Report can be used as BI Publisher and Oracle Discoverer replacement tool. Standard Oracle BI Publisher and Discoverer reports can also be imported into Blitz Report for immediate output to Excel. Typically, reports can be created and version tracked within hours instead of days. The concurrent request output automatically opens upon completion without the need for re-formatting.
The Filters, Columns, Rows and Values fields are used to create and deliver the data in pivot table format with full drill down to details.
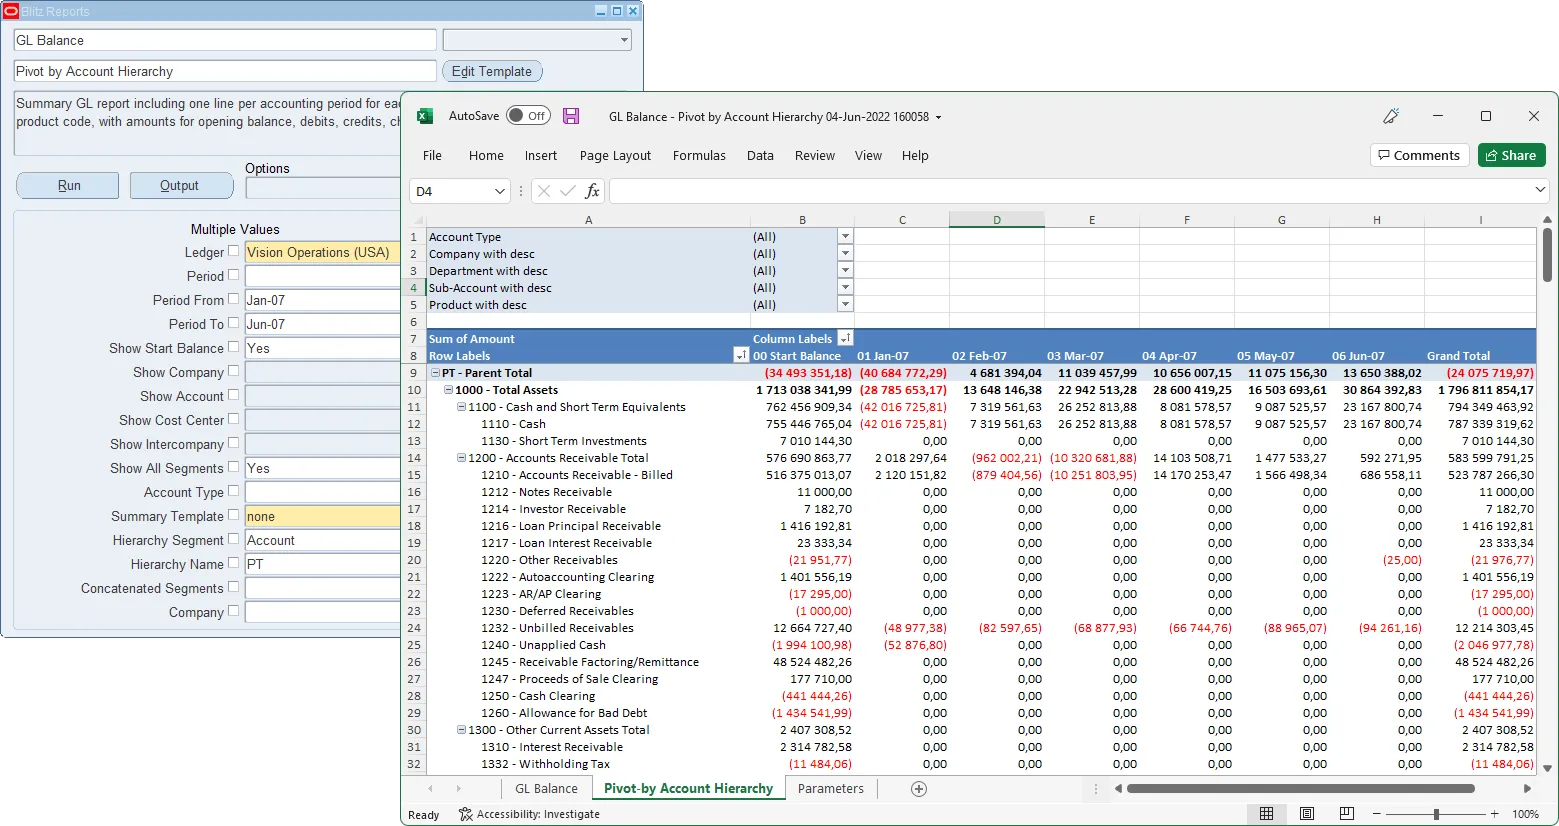
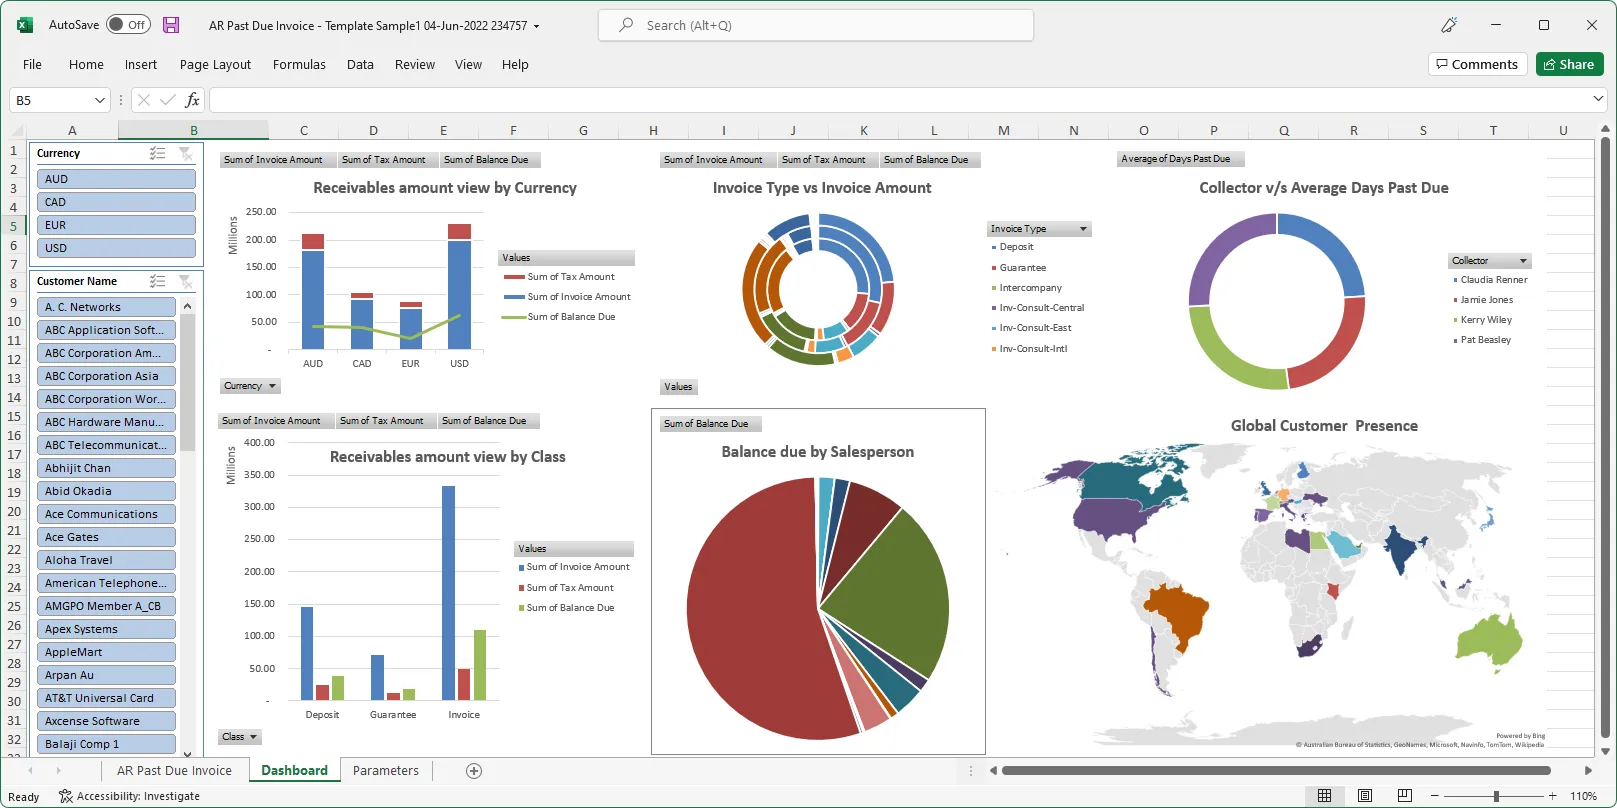
The Excel template upload functionality in Blitz Report allows users to create their own layouts by uploading an Excel template with additional sheets and charts, automatically refreshed when the report runs again. This allows to create custom dashboards and more advanced visualizations of report data.
You can download and use Blitz Report free of charge for your first 30 reports.
The installation and implementation process usually takes less than 1 hour; you can refer to our installation and user guides for specific details.
If you would like to optimize your Oracle EBS implementation and or operational reporting you can visit www.enginatics.com to review great ideas and example usage in blog. Or why not try for yourself in our demo environment.
Useful Links
Blitz Report™ – World’s fastest data upload and reporting for Oracle EBS
Oracle Discoverer replacement – importing worksheets into Blitz Report™
Blitz Report™ Questions & Answers
Supply Chain Hub by Blitz Report™
© 2025 Enginatics