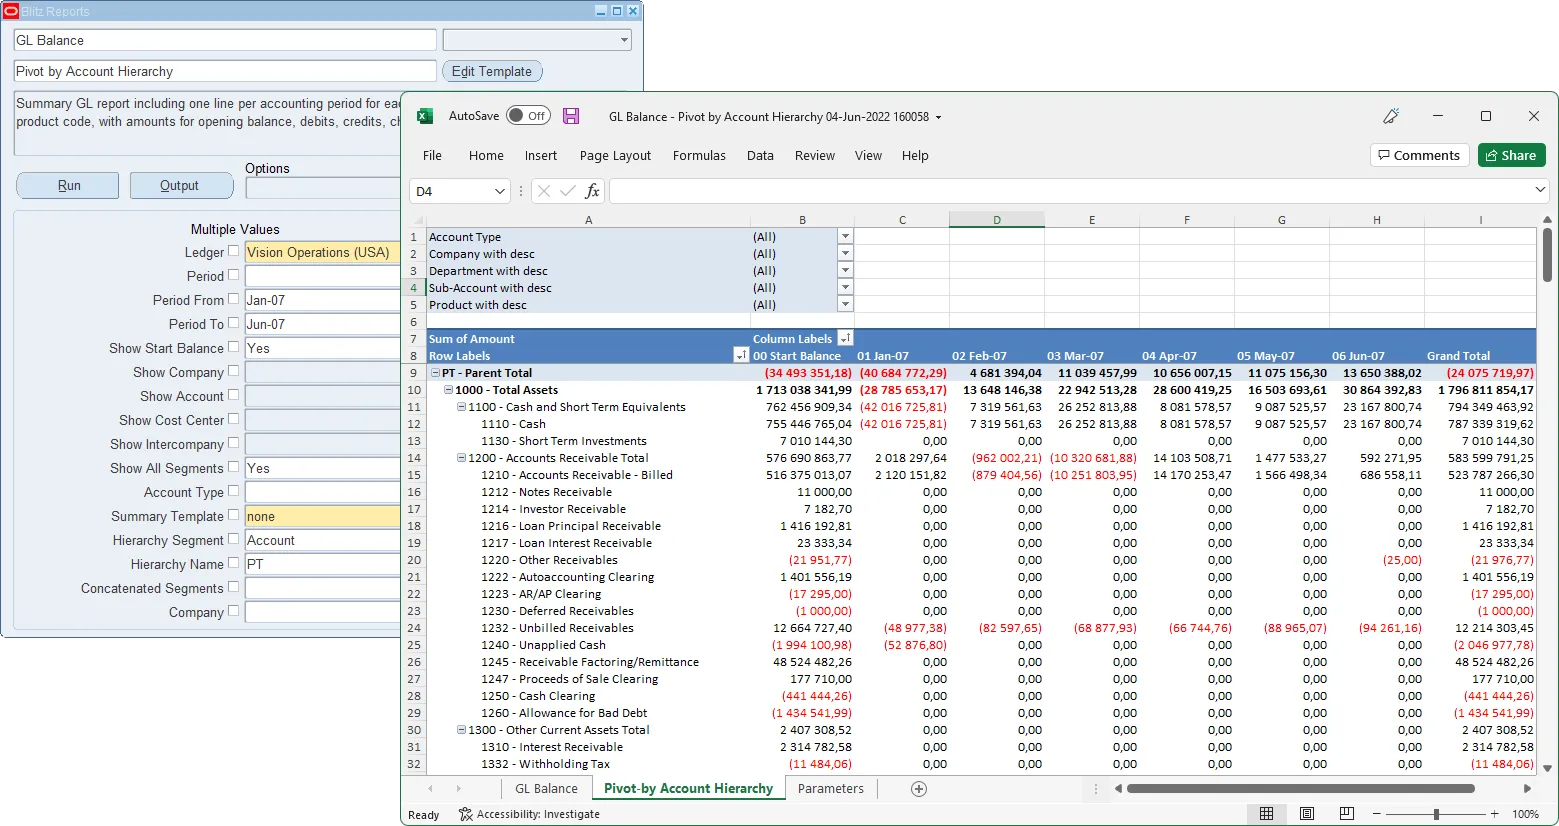
GL Balance (pivot)
Description:
Summary GL report including one line per account segment level, including product code, with opening balance, total transaction amount per month for each period selected, and closing balance (trial balance).
Parameters
Ledger, Ledger Category, Period, Show Full Year, Show Company, Show Account, Show Cost Center, Show Intercompany, Show All Segments, Summary Template, Show Account Type, Account Type, Concatenated Segments, GL_SEGMENT1, GL_SEGMENT1 From, GL_SEGMENT1 To, GL_SEGMENT2, GL_SEGMENT2 From, GL_SEGMENT2 To, GL_SEGMENT3, GL_SEGMENT3 From, GL_SEGMENT3 To, GL_SEGMENT4, GL_SEGMENT4 From, GL_SEGMENT4 To, GL_SEGMENT5, GL_SEGMENT5 From, GL_SEGMENT5 To, GL_SEGMENT6, GL_SEGMENT6 From, GL_SEGMENT6 To, GL_SEGMENT7, GL_SEGMENT7 From, GL_SEGMENT7 To, GL_SEGMENT8, GL_SEGMENT8 From, GL_SEGMENT8 To, GL_SEGMENT9, GL_SEGMENT9 From, GL_SEGMENT9 To, GL_SEGMENT10, GL_SEGMENT10 From, GL_SEGMENT10 To, Revaluation Currency, Revaluation Conversion Type, Balance Type, Budget Name, Encumbrance Type, Exclude Inactive, Batch, Journal
Used tables
gl_daily_conversion_types, gl_daily_rates, gl_ledgers, gl_period_statuses, gl_balances, gl_code_combinations_kfv, fnd_lookup_values_vl
Categories
Related reports
GL Balance by Account Hierarchy
Dependencies
If you would like to try one of these Oracle EBS SQLs without having Blitz Report installed, note that some of the reports require functions from utility package xxen_util.
Example Report
GL Balance (pivot) 04-Aug-2021 053428.xlsx
Report SQL
www.enginatics.com/reports/gl-balance-pivot/
Blitz Report™ import options
GL Balance (pivot) - Case Study & Technical Analysis
Executive Summary
The GL Balance (pivot) report is an advanced analytical tool designed to present General Ledger data in a pivot-friendly format. Unlike standard list reports, this solution is optimized for trend analysis and cross-tabulation, displaying one line per account segment level with columns for opening balance, monthly transaction totals, and closing balances. It empowers finance professionals to perform dynamic analysis directly in Excel, facilitating rapid identification of trends, variances, and anomalies across periods.
Business Challenge
Traditional financial reports often present data in a static, row-based format that is difficult to analyze over time.
- Trend Analysis: Identifying seasonal trends or month-over-month variances requires manual restructuring of data.
- Data Density: Standard reports may produce excessive pages for multi-period analysis, making it hard to see the “big picture.”
- Flexibility: Users often need to pivot data by different dimensions (e.g., Cost Center vs. Account) ad-hoc, which static reports cannot accommodate.
Solution
The GL Balance (pivot) report transforms GL data into a matrix format, ideal for pivot tables. It aggregates transaction amounts per month for the selected period range, providing a horizontal view of financial activity.
Key Features:
- Pivot-Ready Output: Data is structured to be easily summarized in Excel Pivot Tables.
- Monthly Columns: Provides separate columns for each period’s activity within the selected range.
- Granular Control: Allows users to select which segments to include in the grouping (Company, Account, Cost Center, etc.).
- Comprehensive Balances: Includes Opening Balance and Closing (Trial) Balance alongside monthly movements.
- Currency Conversion: Supports revaluation currency and conversion types for multi-currency reporting.
Technical Architecture
This report utilizes a pivot logic within the SQL query to transpose period rows into columns, leveraging the GL_BALANCES table as the core data source.
Key Tables and Views
GL_BALANCES: Stores the period balances for code combinations.GL_LEDGERS: Provides ledger configuration details.GL_PERIOD_STATUSES: Used to validate and order accounting periods.GL_DAILY_RATES&GL_DAILY_CONVERSION_TYPES: Used for currency conversion calculations if revaluation parameters are selected.GL_CODE_COMBINATIONS_KFV: Provides the account segment values and descriptions.
Core Logic
- Data Selection: Selects relevant balances from
GL_BALANCESbased on the Ledger, Currency, and Period range. - Grouping: Aggregates data based on the user-selected segments (e.g.,
GL_SEGMENT1,GL_SEGMENT2). - Pivoting: The SQL uses conditional aggregation (e.g.,
SUM(CASE WHEN period_name = 'Jan-23' THEN period_net_dr - period_net_cr ELSE 0 END)) to create separate columns for each month’s activity. - Balance Calculation:
- Opening Balance: Sum of balances prior to the start period.
- Closing Balance: Opening Balance + Sum of all monthly activities in the range.
Business Impact
- Strategic Insight: Facilitates easy identification of financial trends and seasonality.
- Efficiency: Eliminates the need for manual data manipulation and formatting in Excel.
- Flexibility: Empowers users to create their own views and dashboards using standard Excel Pivot Table functionality.
- Data Integrity: Ensures that the pivoted data ties back directly to the source of truth in Oracle GL.
Oracle E-Business Suite Reporting Library
We provide an open source Oracle EBS SQLs as a part of operational and project implementation support toolkits for rapid Excel reports generation.
Blitz Report™ is based on Oracle EBS forms technology, and hence requires minimal training. There are no data or performance limitations since the output files are created directly from the database without going through intermediate file formats such as XML.
Blitz Report can be used as BI Publisher and Oracle Discoverer replacement tool. Standard Oracle BI Publisher and Discoverer reports can also be imported into Blitz Report for immediate output to Excel. Typically, reports can be created and version tracked within hours instead of days. The concurrent request output automatically opens upon completion without the need for re-formatting.
The Filters, Columns, Rows and Values fields are used to create and deliver the data in pivot table format with full drill down to details.
The Excel template upload functionality in Blitz Report allows users to create their own layouts by uploading an Excel template with additional sheets and charts, automatically refreshed when the report runs again. This allows to create custom dashboards and more advanced visualizations of report data.
You can download and use Blitz Report free of charge for your first 30 reports.
The installation and implementation process usually takes less than 1 hour; you can refer to our installation and user guides for specific details.
If you would like to optimize your Oracle EBS implementation and or operational reporting you can visit www.enginatics.com to review great ideas and example usage in blog. Or why not try for yourself in our demo environment.
Useful Links
Blitz Report™ – World’s fastest data upload and reporting for Oracle EBS
Oracle Discoverer replacement – importing worksheets into Blitz Report™
Blitz Report™ Questions & Answers
Supply Chain Hub by Blitz Report™
© 2025 Enginatics