GL Balance by Account Hierarchy
Description:
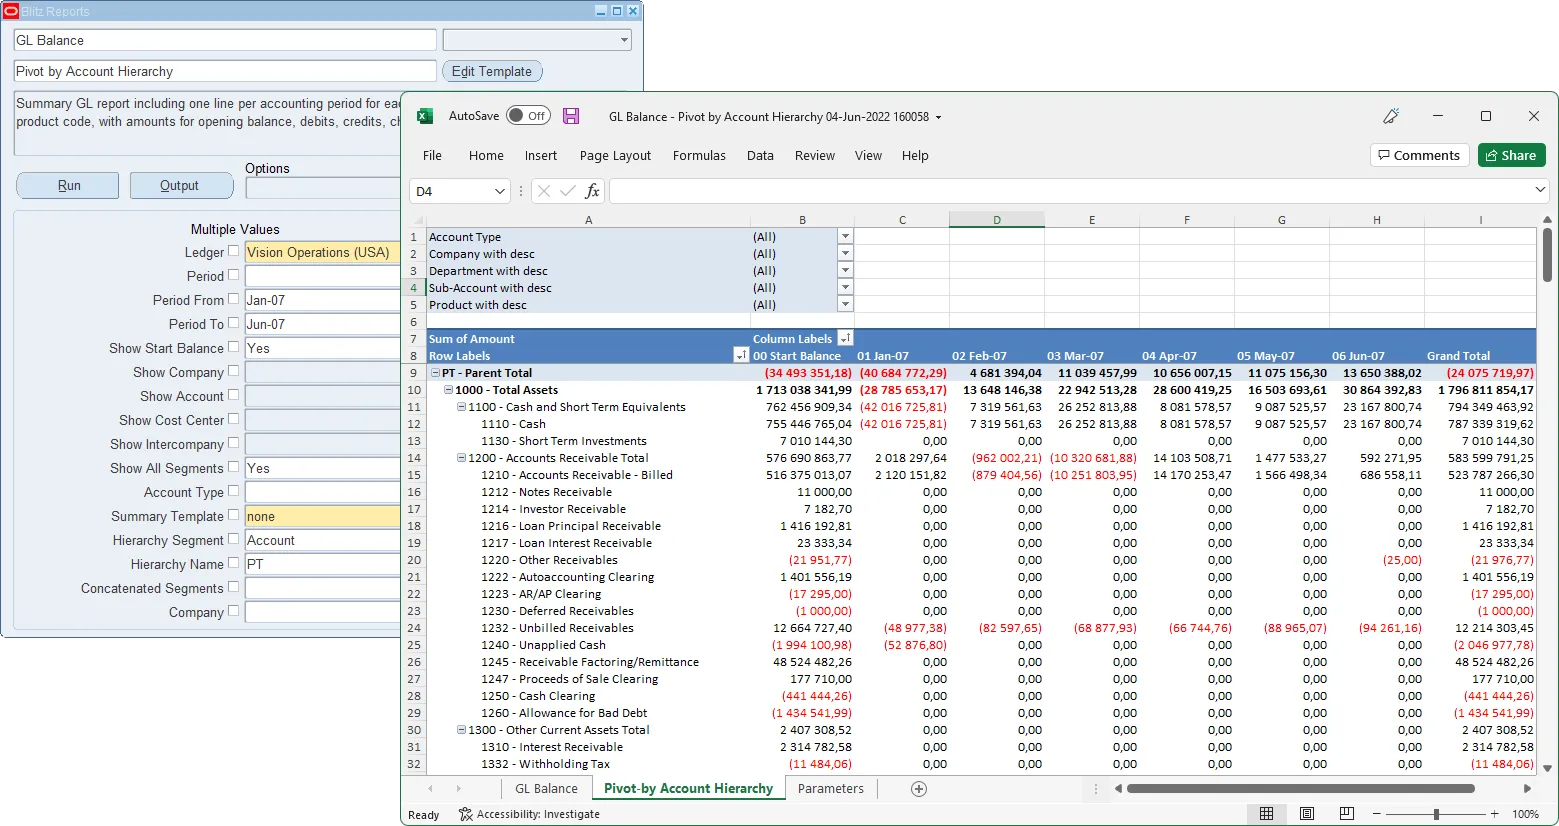
Summary GL report including one line per GL account. This report has multiple collapsible/expandable summary levels based on the GL account hierarchy, with starting balance, total amount per month, ending total and YTD balance. Parameter ‘Additional Segment’ can be used to include additional segments e.g. cost center or balancing segment.
Parameters
Ledger, Ledger Category, Period, Show Full Year, Hierarchy Segment, Additional Segment1, Additional Segment2, Additional Segment3, Sort by Additional Segment, Hierarchy Name, Show Account Type, Account Type, Show Child Account Level, Summary Template only, Revaluation Currency, Revaluation Conversion Type, Balance Type, Budget Name, Encumbrance Type, Exclude Inactive
Used tables
gl_daily_conversion_types, gl_daily_rates, gl_ledgers, gl_period_statuses, gl_balances, fnd_id_flex_segments, gl_code_combinations, fnd_flex_values, fnd_flex_value_norm_hierarchy, table, fnd_segment_attribute_values, gl_summary_templates, fnd_lookup_values_vl
Categories
Dependencies
If you would like to try one of these Oracle EBS SQLs without having Blitz Report installed, note that some of the reports require functions from utility package xxen_util.
Example Report
GL Balance by Account Hierarchy 12-Nov-2020 012923.xlsx
Report SQL
www.enginatics.com/reports/gl-balance-by-account-hierarchy/
Blitz Report™ import options
GL_Balance_by_Account_Hierarchy.xml
GL Balance by Account Hierarchy - Case Study & Technical Analysis
Executive Summary
The GL Balance by Account Hierarchy report is a sophisticated financial reporting solution that leverages Oracle General Ledger’s parent-child account relationships. It presents balances in a hierarchical format, allowing users to drill down from high-level summary accounts to detailed child accounts. This report is vital for producing financial statements (like Balance Sheets and Income Statements) directly from the system, respecting the defined rollup structures.
Business Challenge
Organizations define complex account hierarchies to structure their financial reporting. However, extracting data that respects these hierarchies can be challenging:
- Hierarchy Complexity: Parent accounts often aggregate data from multiple child accounts across different ranges.
- Reporting Gaps: Standard reports often show only detail accounts or flat lists, losing the context of the financial structure.
- Maintenance: As hierarchies change (e.g., new cost centers, reorganized departments), reports must automatically reflect these changes without manual updates.
- Visibility: Managers need to see both the summary level performance and the contributing details in a single view.
Solution
The GL Balance by Account Hierarchy report dynamically traverses the defined Flexfield Value Set Hierarchies to present a structured view of GL balances.
Key Features:
- Hierarchical Display: Shows parent accounts and their children in a collapsible/expandable format (in tools that support it) or structured list.
- Rollup Logic: Automatically aggregates balances from child accounts to their respective parents.
- Multi-Level Analysis: Supports multiple levels of nesting within the account structure.
- Segment Flexibility: Allows reporting based on the hierarchy of a specific segment (usually the Natural Account or Cost Center).
- Additional Segmentation: Users can include additional segments (e.g., Balancing Segment) to analyze the hierarchy within specific business units.
Technical Architecture
The report relies on the recursive relationships defined in the Application Object Library (AOL) flexfield tables to build the hierarchy and join it with GL balances.
Key Tables and Views
FND_FLEX_VALUE_NORM_HIERARCHY: Defines the parent-child ranges for flexfield values.FND_FLEX_VALUES: Stores the individual segment values (both parents and children).GL_BALANCES: The source of financial data.GL_CODE_COMBINATIONS: Links balances to specific accounts.FND_ID_FLEX_SEGMENTS: Used to identify which segment holds the hierarchy.GL_SUMMARY_TEMPLATES: (Optional) Used if summary templates are leveraged for performance.
Core Logic
- Hierarchy Traversal: The query uses hierarchical SQL (e.g.,
CONNECT BY) or recursive joins onFND_FLEX_VALUE_NORM_HIERARCHYto establish the parent-child tree structure. - Balance Assignment: Detail balances from
GL_BALANCESare assigned to the lowest level (child) nodes in the tree. - Aggregation: Balances are rolled up the tree, summing child balances to populate parent nodes.
- Filtering: The report filters by Ledger, Period, and the specific Hierarchy Name selected by the user.
Business Impact
- Strategic Reporting: Enables the generation of hierarchy-based financial statements directly from Oracle EBS.
- Data Consistency: Ensures that reporting always reflects the current, active account hierarchy definition.
- Drill-Down Capability: Provides transparency into the composition of summary balances, aiding in variance analysis.
- User Empowerment: Allows finance users to validate hierarchy changes immediately by running the report.
Oracle E-Business Suite Reporting Library
We provide an open source Oracle EBS SQLs as a part of operational and project implementation support toolkits for rapid Excel reports generation.
Blitz Report™ is based on Oracle EBS forms technology, and hence requires minimal training. There are no data or performance limitations since the output files are created directly from the database without going through intermediate file formats such as XML.
Blitz Report can be used as BI Publisher and Oracle Discoverer replacement tool. Standard Oracle BI Publisher and Discoverer reports can also be imported into Blitz Report for immediate output to Excel. Typically, reports can be created and version tracked within hours instead of days. The concurrent request output automatically opens upon completion without the need for re-formatting.
The Filters, Columns, Rows and Values fields are used to create and deliver the data in pivot table format with full drill down to details.
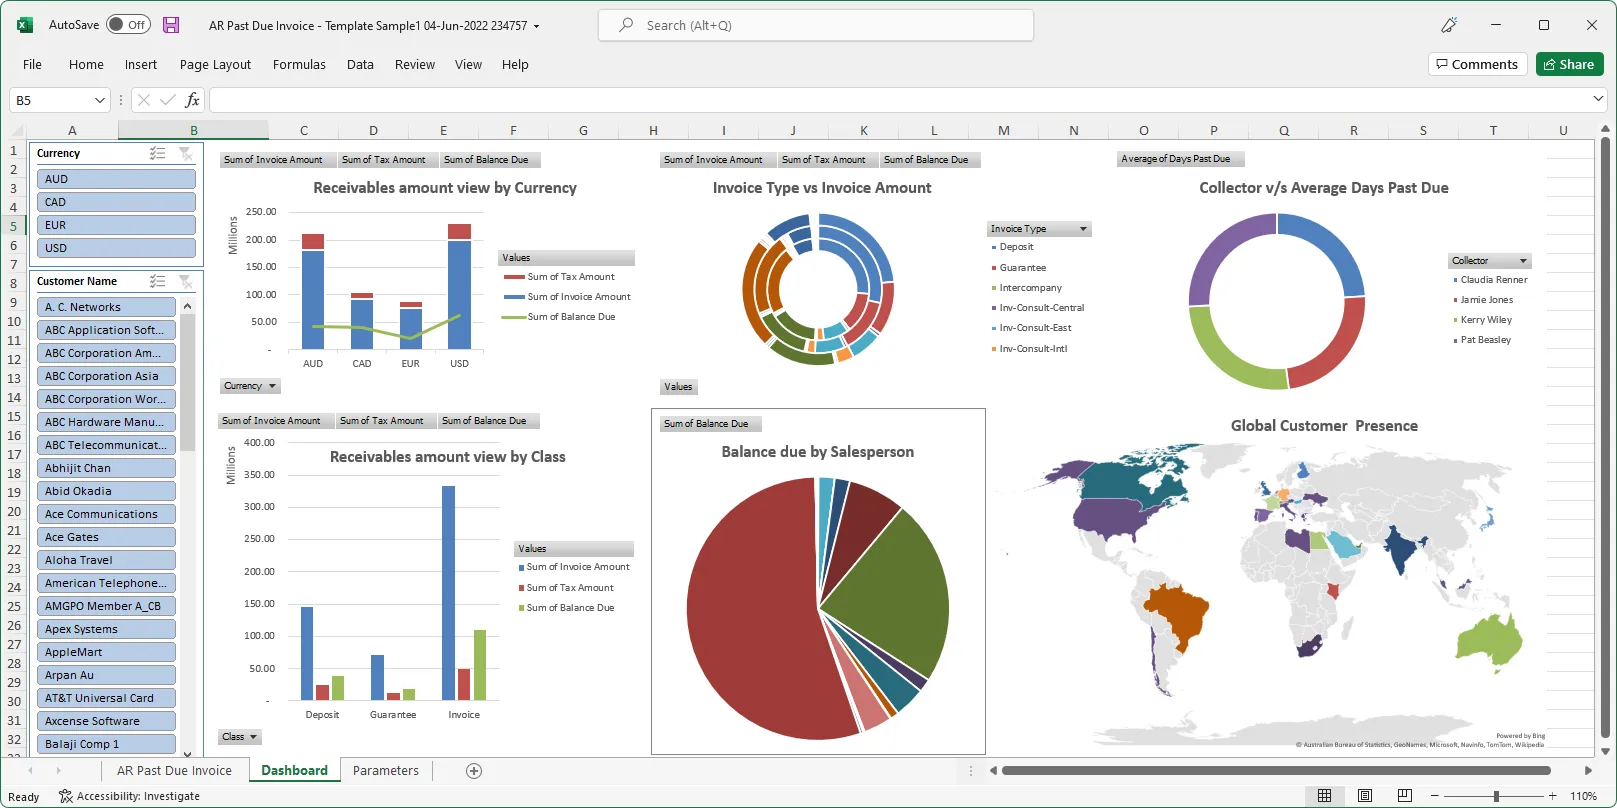
The Excel template upload functionality in Blitz Report allows users to create their own layouts by uploading an Excel template with additional sheets and charts, automatically refreshed when the report runs again. This allows to create custom dashboards and more advanced visualizations of report data.
You can download and use Blitz Report free of charge for your first 30 reports.
The installation and implementation process usually takes less than 1 hour; you can refer to our installation and user guides for specific details.
If you would like to optimize your Oracle EBS implementation and or operational reporting you can visit www.enginatics.com to review great ideas and example usage in blog. Or why not try for yourself in our demo environment.
Useful Links
Blitz Report™ – World’s fastest data upload and reporting for Oracle EBS
Oracle Discoverer replacement – importing worksheets into Blitz Report™
Blitz Report™ Questions & Answers
Supply Chain Hub by Blitz Report™
© 2025 Enginatics