OPM Batch Lot Cost Trends
Description:
OPM Batch Lot Costing Trends Report
This report shows the Batch Lot Costs for the specified Organization and Product over a specified date range.
The report shows the Lot Cost for the batch product and explodes the batch to display all the lowest level ingredient lot costs involved in producing the batch.
Where an ingredient is sourced from another (child) batch, the (child) batch ingredient quantities are apportioned based on the actual usage of the ingredient in the batch consuming that ingredient.
By default, intermediate ingredients are not displayed in the report, so as not to overstate the ingredient lot costs. To override this default behaviour set the ‘Show Intermediate Ingredients’ report parameter to Yes
The report allows the user to pull in several additional data points to allow further analysis of data based on the customer specific configuration. Specifically, for the both the batch product (same for all lines in the batch) and for the batch ingredients (are specific to each line in the batch), the following additional data can be pulled into the report.
- Item Catalog Descriptive Elements for a specific Item Catalog Group
- Item Category Segments for a specific Item Category Set
- Item Descriptive Flexfield Attributes
Parameters
Organization Code, From Date, To Date, Product, Formula Class, Batch, Cost Type, Product Category Set, Product Item Catalog, Show Product Item DFF, Ingredient Category Set, Ingredient Item Catalog, Show Ingredient Item DFF, Include Intermediate Ingredients
Used tables
xmltable, fm_form_mst, gmd_formula_class, gl_ledger_le_v, opm_batch_lot_costs, gme_batch_header, gme_material_details, org_organization_definitions, mtl_system_items_vl
Categories
Dependencies
If you would like to try one of these Oracle EBS SQLs without having Blitz Report installed, note that some of the reports require functions from utility package xxen_util.
Example Report
OPM Batch Lot Cost Trends - Detail Pivot 01-Aug-2025 091821.xlsx
Report SQL
www.enginatics.com/reports/opm-batch-lot-cost-trends/
Blitz Report™ import options
Case Study & Technical Analysis: OPM Batch Lot Cost Trends Report
Executive Summary
The OPM Batch Lot Cost Trends report is a sophisticated cost analysis tool designed for Oracle Process Manufacturing (OPM) environments. It provides a historical, trend-based view of a product’s actual manufacturing costs over time. The report’s key feature is its ability to perform a true cost roll-up, exploding a production batch down to its lowest-level raw material ingredients while intelligently apportioning the costs of any intermediate sub-assemblies. This makes it an invaluable tool for cost accountants, product managers, and financial analysts seeking to understand cost fluctuations and analyze product profitability.
Business Challenge
While analyzing the cost of a single batch is important, understanding how a product’s costs behave over time is critical for strategic decision-making. Businesses face several challenges in this area:
- Tracking Cost Fluctuations: It is very difficult to track the actual production cost of a finished good over several weeks or months. This makes it hard to identify creeping cost increases or the impact of raw material price volatility.
- True “Seed-to-Sale” Costing: In a multi-level manufacturing process, calculating the true cost contribution of the base raw materials is incredibly complex. It requires a proper apportionment of the costs of intermediate batches, a task that is virtually impossible to do accurately and efficiently in spreadsheets.
- Data Overload: A simple multi-level bill of materials explosion can overstate costs by double-counting the value of intermediate products. Analysts need a report that intelligently hides these intermediates to show a true raw material cost roll-up.
- Informed Pricing and Margin Analysis: Without accurate historical cost data, setting optimal sales prices and understanding true product margins is based on guesswork rather than data.
The Solution
This report provides a powerful and unique view of product costs, enabling deep trend and profitability analysis.
- Historical Cost Trend Analysis: By selecting a product and a date range, users can see a history of completed batch costs, making it easy to spot trends, identify anomalies, and investigate the reasons for cost changes.
- Accurate Cost Apportionment: The report’s core logic intelligently apportions the costs of consumed child batches. If a parent batch uses only 20% of a child batch’s output, only 20% of the child batch’s costs are rolled up, providing a true and accurate final product cost.
- Lowest-Level Ingredient View: By default, the report hides intermediate products and explodes the formula down to the base raw materials. This provides a clean “rolled-up” view, perfect for understanding which raw material price changes are impacting the finished good.
- Data-Driven Profitability Studies: The clean, historical cost data provided by this report is the ideal input for conducting detailed product margin analysis, helping the business to make informed decisions about pricing, sourcing, and product lifecycle management.
Technical Architecture (High Level)
The report uses a complex SQL query to traverse the batch production hierarchy and accurately allocate costs.
- Primary Tables Involved:
opm_batch_lot_costs(the source for all actual cost data).gme_batch_header(to identify the batches for a specific product and date range).gme_material_details(the critical table used to find the actual quantity of an intermediate product that was consumed by a parent batch).
- Logical Relationships: For each top-level batch of the selected product, the report recursively traces the ingredient consumption. When it encounters an ingredient that is an intermediate product (from a child batch), it uses the a ctual consumed quantity from
gme_material_detailsto calculate a ratio, and then applies this ratio to the child batch’s costs fromopm_batch_lot_coststo calculate the apportioned cost.
Parameters & Filtering
The parameters allow for both high-level trend analysis and detailed drill-down:
- Primary Filters: Users can analyze trends for a specific
Productwithin anOrganizationover a givenDate Range. - Cost Type: Allows the analysis to be performed using a specific cost method, such as ‘Actual Costing’.
- Include Intermediate Ingredients: A powerful switch that allows the user to change the report’s behavior. When set to ‘No’ (the default), it provides a true rolled-up cost. When set to ‘Yes’, it shows all levels of the production hierarchy, similar to the
OPM Batch Lot Cost Detailsreport.
Performance & Optimization
The report’s complex, multi-level query is optimized by requiring strong driving parameters.
- Mandatory Product Filter: The report is designed to be run for one product at a time. This significantly constrains the initial data set and allows the complex apportionment logic to run efficiently.
- Indexed Date and Item Lookups: The use of date ranges and item numbers as primary filters ensures that the initial selection of top-level batches is performed quickly using standard database indexes.
FAQ
1. What does it mean to ‘apportion’ the cost of a child batch? Apportionment is the process of allocating a portion of a sub-assembly’s cost to the final product. For example, if a child batch makes 100 liters of an additive for a total cost of $1000, and a parent batch consumes 10 liters of that additive, this report will accurately roll up only $100 (10% of the cost) into the parent batch’s cost structure.
2. Why are intermediate ingredients hidden by default? They are hidden to provide a true “cost roll-up” from the perspective of raw materials. If you see the cost of the raw materials and the cost of the intermediate they were used to make, you would be double-counting costs. Hiding the intermediate shows only the base costs and the final product cost.
3. How does this report help with analyzing product margins? By providing the actual historical cost of goods sold (COGS) for a product, you can compare this data directly against the historical sales price data from Order Management. This allows for a precise, data-driven analysis of how the product’s gross margin has trended over time.
Oracle E-Business Suite Reporting Library
We provide an open source Oracle EBS SQLs as a part of operational and project implementation support toolkits for rapid Excel reports generation.
Blitz Report™ is based on Oracle EBS forms technology, and hence requires minimal training. There are no data or performance limitations since the output files are created directly from the database without going through intermediate file formats such as XML.
Blitz Report can be used as BI Publisher and Oracle Discoverer replacement tool. Standard Oracle BI Publisher and Discoverer reports can also be imported into Blitz Report for immediate output to Excel. Typically, reports can be created and version tracked within hours instead of days. The concurrent request output automatically opens upon completion without the need for re-formatting.
The Filters, Columns, Rows and Values fields are used to create and deliver the data in pivot table format with full drill down to details.
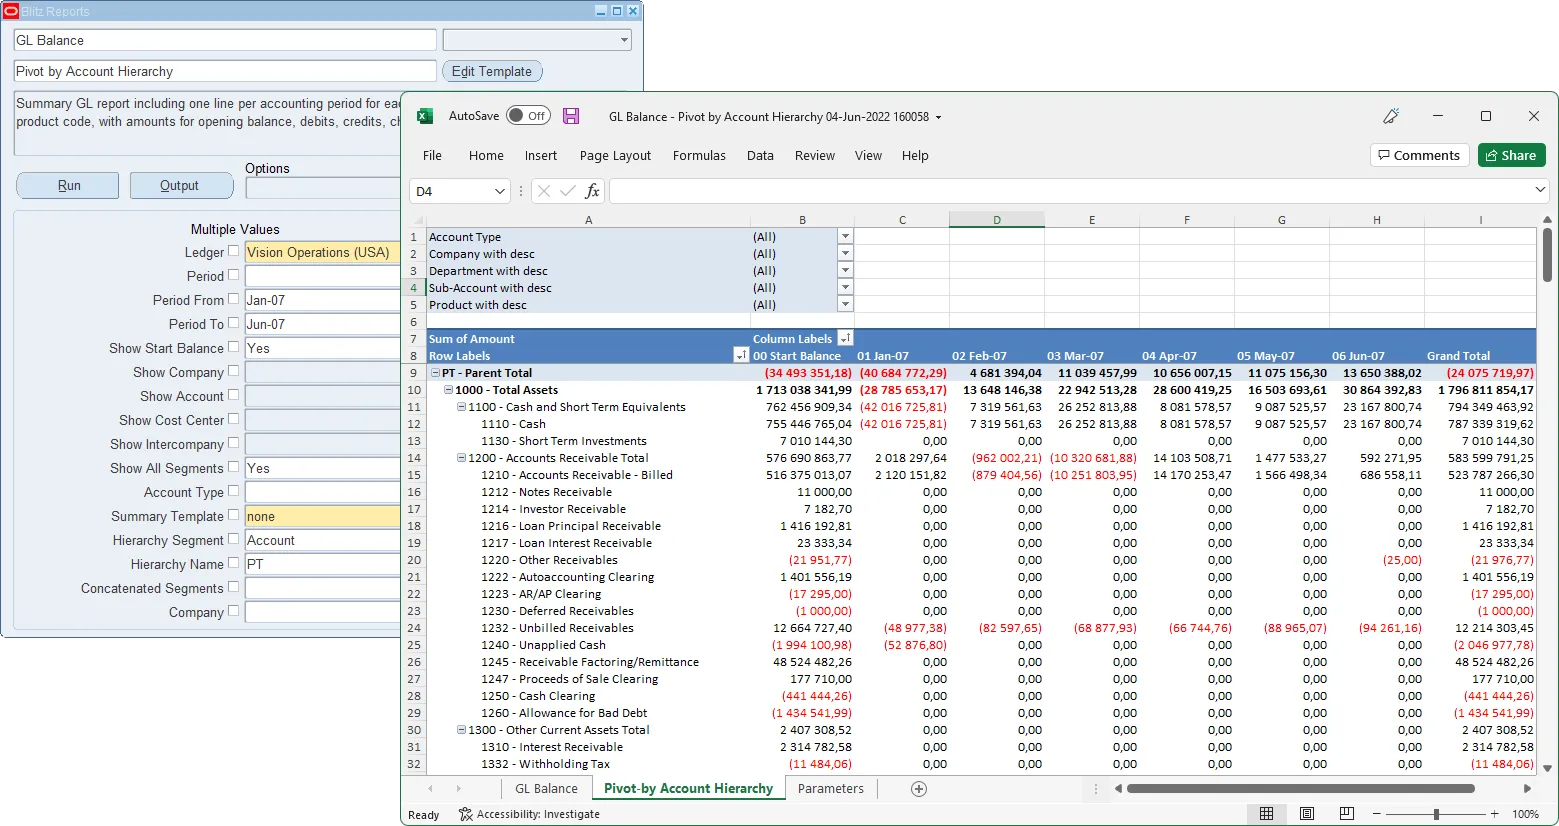
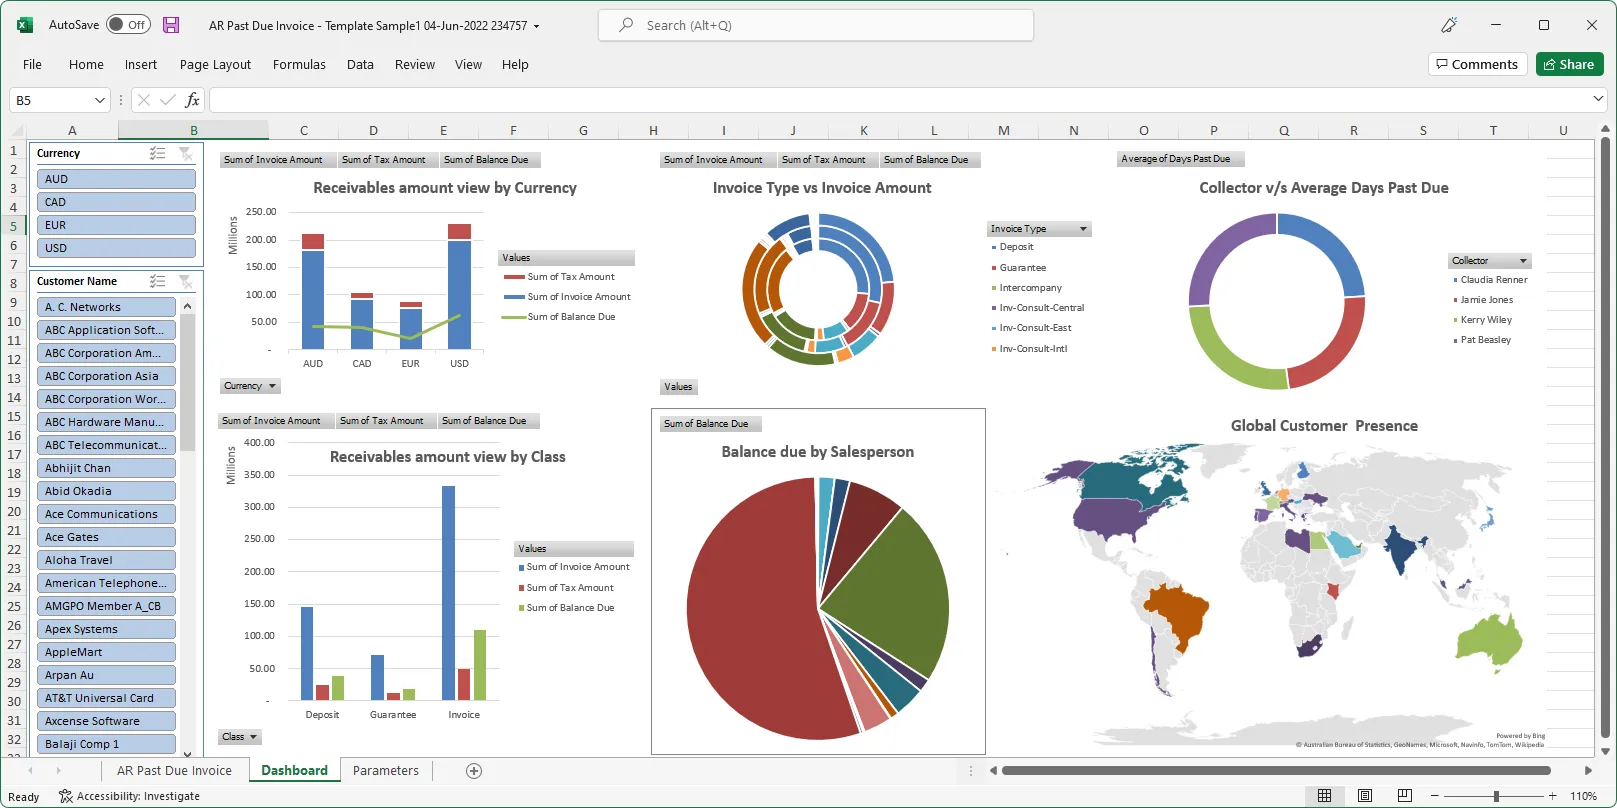
The Excel template upload functionality in Blitz Report allows users to create their own layouts by uploading an Excel template with additional sheets and charts, automatically refreshed when the report runs again. This allows to create custom dashboards and more advanced visualizations of report data.
You can download and use Blitz Report free of charge for your first 30 reports.
The installation and implementation process usually takes less than 1 hour; you can refer to our installation and user guides for specific details.
If you would like to optimize your Oracle EBS implementation and or operational reporting you can visit www.enginatics.com to review great ideas and example usage in blog. Or why not try for yourself in our demo environment.
Useful Links
Blitz Report™ – World’s fastest data upload and reporting for Oracle EBS
Oracle Discoverer replacement – importing worksheets into Blitz Report™
Blitz Report™ Questions & Answers
Supply Chain Hub by Blitz Report™
© 2025 Enginatics