PN Generate Portfolio Summary
Description:
Application: Property Manager Source: Generate Portfolio Summary Report Short Name: PNGPSR_XML DB package: XXEN_PN
Parameters
Operating Unit, As Of Period, End Date, Representation
Used tables
pn_lease_reports_data_gtt, pn_amendment_report_gtt, pn_leases_all, pn_lease_details_all, pn_eqp_leases_all, pn_eqp_lease_details_all, q_portfolio_summary, q_amendment_detail
Categories
Related reports
Dependencies
If you would like to try one of these Oracle EBS SQLs without having Blitz Report installed, note that some of the reports require functions from utility package xxen_util.
Example Report
Report SQL
www.enginatics.com/reports/pn-generate-portfolio-summary/
Blitz Report™ import options
PN_Generate_Portfolio_Summary.xml
Case Study & Technical Analysis: PN Generate Portfolio Summary Report
Executive Summary
The PN Generate Portfolio Summary report is a high-level strategic and financial reporting tool for Oracle Property Management (PN). It provides an aggregated overview of an entire lease portfolio, presenting key financial and operational metrics as of a specified period. This report is essential for executives, financial controllers, and portfolio managers to quickly assess the overall health, performance, and composition of their leased assets, supporting strategic planning, financial forecasting, and compliance initiatives.
Business Challenge
For senior management and financial stakeholders, detailed, lease-by-lease reports can be overwhelming. What is needed is a clear, concise summary of the entire portfolio to support strategic decisions. Organizations often struggle with:
- Lack of Aggregated View: Obtaining a single, high-level summary of the entire lease portfolio (e.g., total annual rent, total leased area, overall occupancy rates) is challenging with standard Oracle reports that focus on individual leases.
- Strategic Decision Support: Without a consolidated summary, making informed strategic decisions about the overall portfolio (e.g., investment in new properties, divestment of underperforming assets, overall market exposure) is difficult.
- Efficient Performance Monitoring: Executives need a quick snapshot to monitor key performance indicators (KPIs) of the portfolio without sifting through granular data. Manual compilation of such summaries is time-consuming and prone to errors.
- Financial Reporting and Compliance: Providing aggregated data for financial statements (especially with new lease accounting standards like ASC 842 and IFRS 16) requires a reliable summary report that accurately reflects the portfolio’s financial position.
The Solution
This report offers a powerful, aggregated solution for comprehensive lease portfolio oversight, transforming complex data into executive-level insights.
- Consolidated Portfolio Metrics: It provides key summarized financial and operational metrics for the entire lease portfolio, such as total revenue, total expenses, number of active leases, and potentially total leased area, all as of a specific reporting period.
- Date-Effective Snapshot: The “As Of Period” parameter is crucial, allowing users to generate a precise snapshot of the portfolio’s summary performance and composition for any given accounting period, vital for trend analysis and historical comparisons.
- Streamlined Executive Reporting: The summarized nature of the report makes it ideal for executive dashboards, board presentations, and quick performance reviews, enabling faster and more informed strategic decision-making.
- Foundation for Compliance: By providing aggregated financial data at the portfolio level, it serves as a valuable input for preparing financial disclosures related to lease accounting standards.
Technical Architecture (High Level)
The report queries core Oracle Property Management tables and leverages Global Temporary Tables (GTTs) for efficient aggregation and summarization of portfolio data.
- Primary Tables/Views Involved:
pn_leases_allandpn_lease_details_all(to gather foundational lease data).pn_eqp_leases_allandpn_eqp_lease_details_all(corresponding tables for equipment leases).pn_lease_reports_data_gttandpn_amendment_report_gtt(Global Temporary Tables used to stage and process intermediate detailed data before summarization, ensuring high performance).q_portfolio_summary(likely a complex view or internal query logic that performs the final aggregations).
- Logical Relationships: The report first gathers detailed lease information (potentially into GTTs) from various PN tables for the specified period. It then performs aggregations (e.g., sums, counts) across these detailed records to produce the high-level summary metrics. The use of GTTs is critical here to efficiently handle the intermediate data processing for a large portfolio.
Parameters & Filtering
The report offers focused parameters for strategic portfolio summaries:
- Operating Unit: Filters the report to a specific business unit or organizational context.
- As Of Period: The primary parameter for time-sensitive reporting, allowing users to select the accounting period for which they want to view the portfolio summary.
- End Date: Often works in conjunction with
As Of Periodto define the exact end point of the reporting period. - Representation: (If applicable) Allows selection of the currency or format in which financial amounts are displayed (e.g., functional currency, reporting currency).
Performance & Optimization
As an aggregated report designed for large portfolios, it utilizes specific optimizations for efficiency.
- Global Temporary Tables (GTTs): The use of GTTs is a significant optimization. They enable the report to perform complex intermediate aggregations and calculations for the entire portfolio efficiently by storing temporary results without impacting transaction logs or permanent storage.
- Period-Driven Aggregation: The
As Of PeriodandEnd Dateparameters are crucial for performance. They ensure that the report only aggregates data relevant to the specified timeframe, preventing unnecessary processing of historical or future data. - Pre-aggregated Data (if applicable): The
q_portfolio_summaryreference suggests the use of pre-aggregated data or highly optimized views for rapid summary calculations.
FAQ
1. What is the key difference between this ‘Portfolio Summary’ and the ‘Portfolio Detail’ reports? This ‘Portfolio Summary’ report provides an aggregated, high-level overview of the entire lease portfolio (e.g., total revenue, total occupied area), ideal for executive reviews and strategic planning. The ‘Portfolio Detail’ report offers a granular, lease-by-lease breakdown of all individual lease attributes and terms, suited for operational management and in-depth auditing.
2. Can this report be used to compare portfolio performance over different periods?
Yes, by running the report for multiple As Of Period values and exporting the results, users can compare key metrics of the portfolio (e.g., total revenue, occupancy rate) across different accounting periods to analyze trends and assess changes in portfolio performance.
3. Does this report include both revenue and expense aspects of the portfolio? Typically, a comprehensive portfolio summary like this would include both revenue-generating leases (e.g., tenant rents) and expense-incurring leases (e.g., landlord obligations for master leases or equipment). The report provides an overall financial health check of the entire lease portfolio.
Oracle E-Business Suite Reporting Library
We provide an open source Oracle EBS SQLs as a part of operational and project implementation support toolkits for rapid Excel reports generation.
Blitz Report™ is based on Oracle EBS forms technology, and hence requires minimal training. There are no data or performance limitations since the output files are created directly from the database without going through intermediate file formats such as XML.
Blitz Report can be used as BI Publisher and Oracle Discoverer replacement tool. Standard Oracle BI Publisher and Discoverer reports can also be imported into Blitz Report for immediate output to Excel. Typically, reports can be created and version tracked within hours instead of days. The concurrent request output automatically opens upon completion without the need for re-formatting.
The Filters, Columns, Rows and Values fields are used to create and deliver the data in pivot table format with full drill down to details.
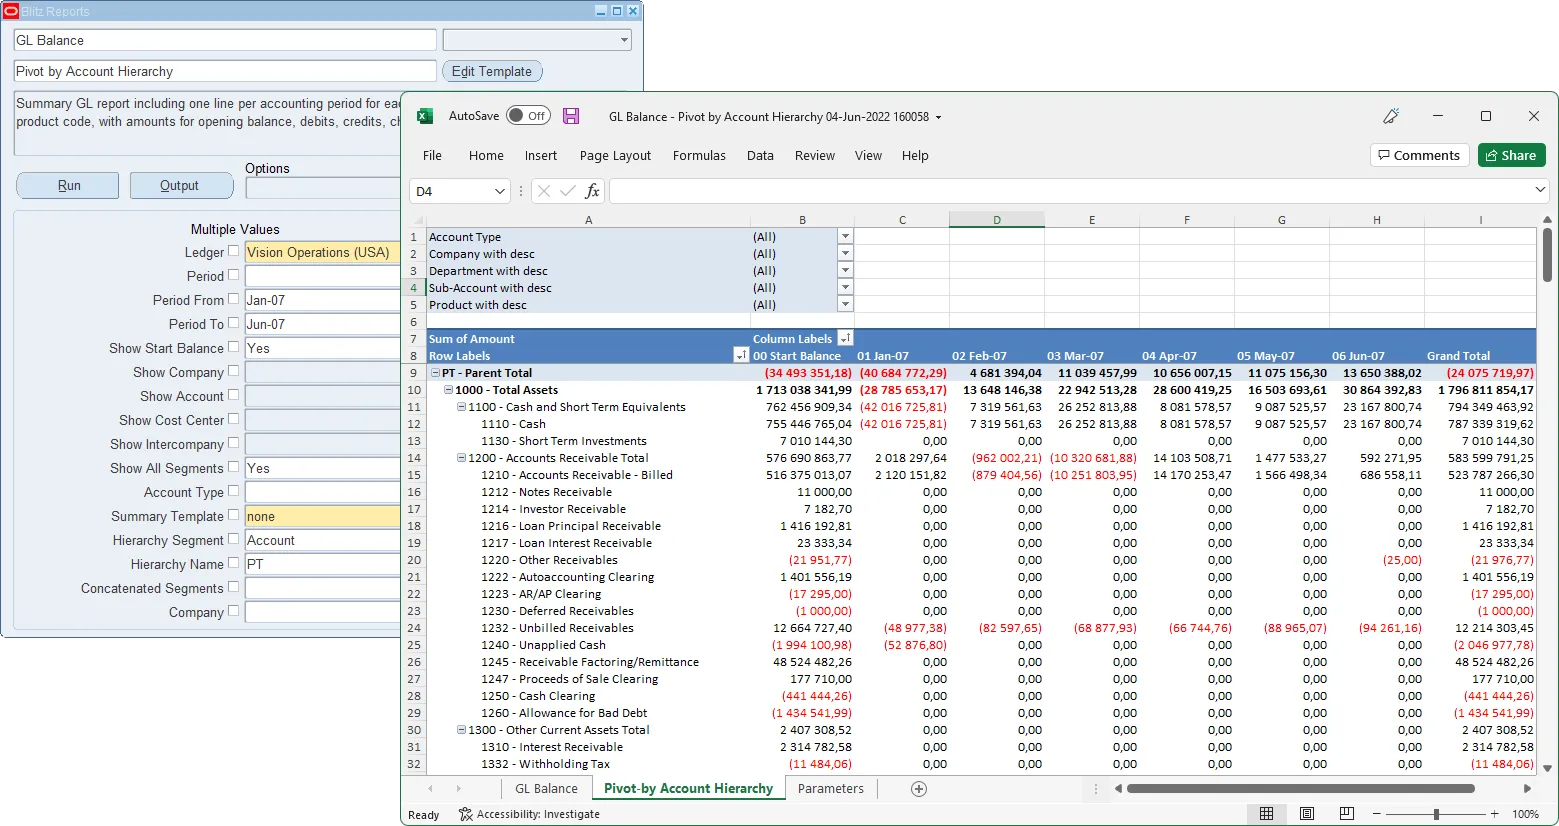
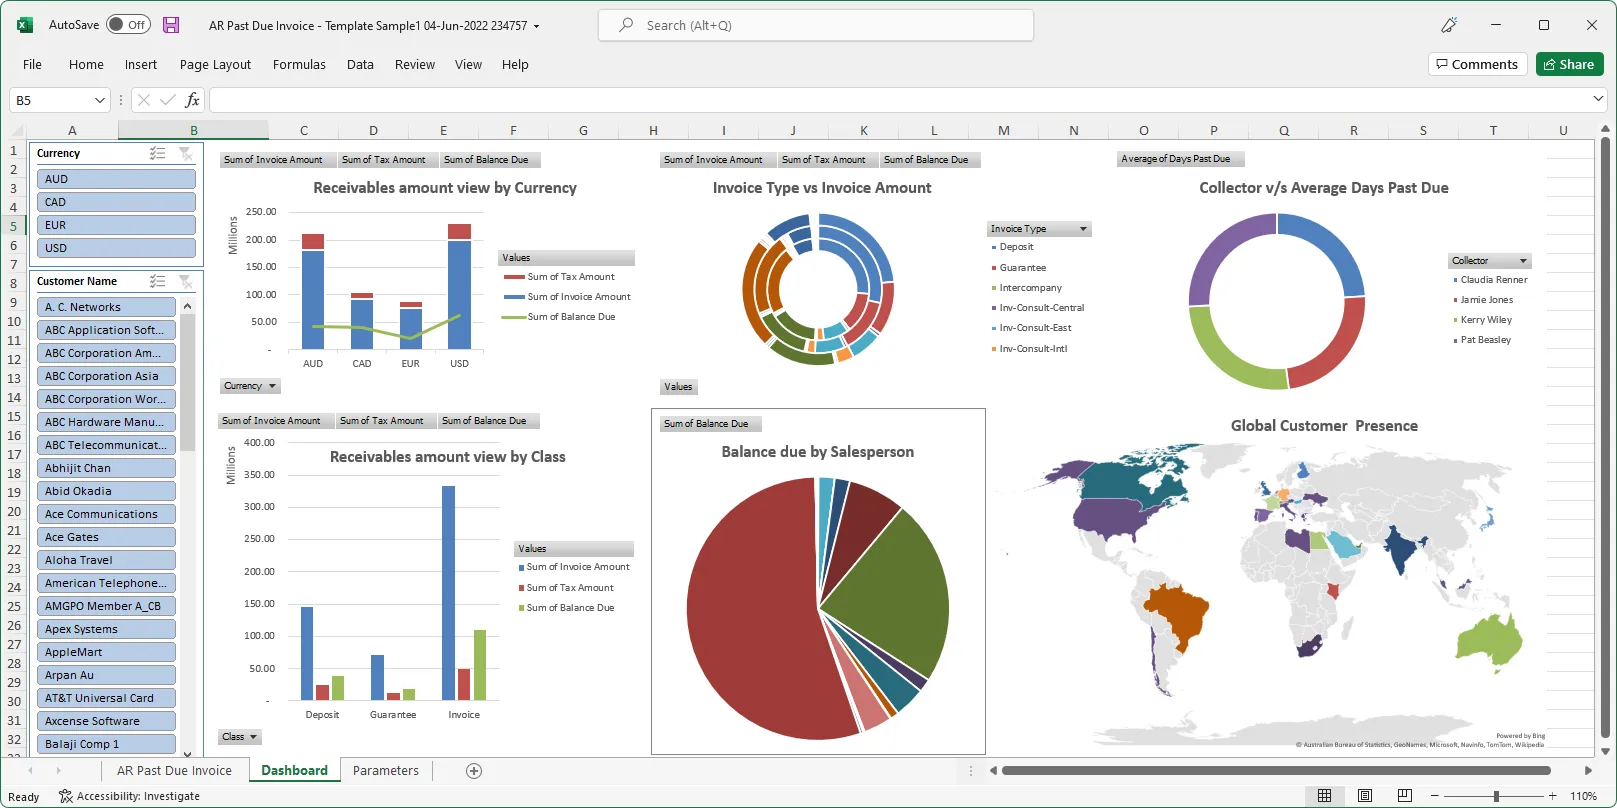
The Excel template upload functionality in Blitz Report allows users to create their own layouts by uploading an Excel template with additional sheets and charts, automatically refreshed when the report runs again. This allows to create custom dashboards and more advanced visualizations of report data.
You can download and use Blitz Report free of charge for your first 30 reports.
The installation and implementation process usually takes less than 1 hour; you can refer to our installation and user guides for specific details.
If you would like to optimize your Oracle EBS implementation and or operational reporting you can visit www.enginatics.com to review great ideas and example usage in blog. Or why not try for yourself in our demo environment.
Useful Links
Blitz Report™ – World’s fastest data upload and reporting for Oracle EBS
Oracle Discoverer replacement – importing worksheets into Blitz Report™
Blitz Report™ Questions & Answers
Supply Chain Hub by Blitz Report™
© 2025 Enginatics